Profitability! Undoubtedly one of the biggest issues for those selling their products online. The proliferation of omnichannel shopping has further complicated matters, and brands are struggling to figure out how to turn a profit across each channel.
Bobsled CEO Kiri Masters recently interviewed 10 members of the Digital Shelf Executive Forum for a webinar and profitability report. These executive-level digital and ecommerce leaders all come from large, multinational brands with annual revenues over $250 million.
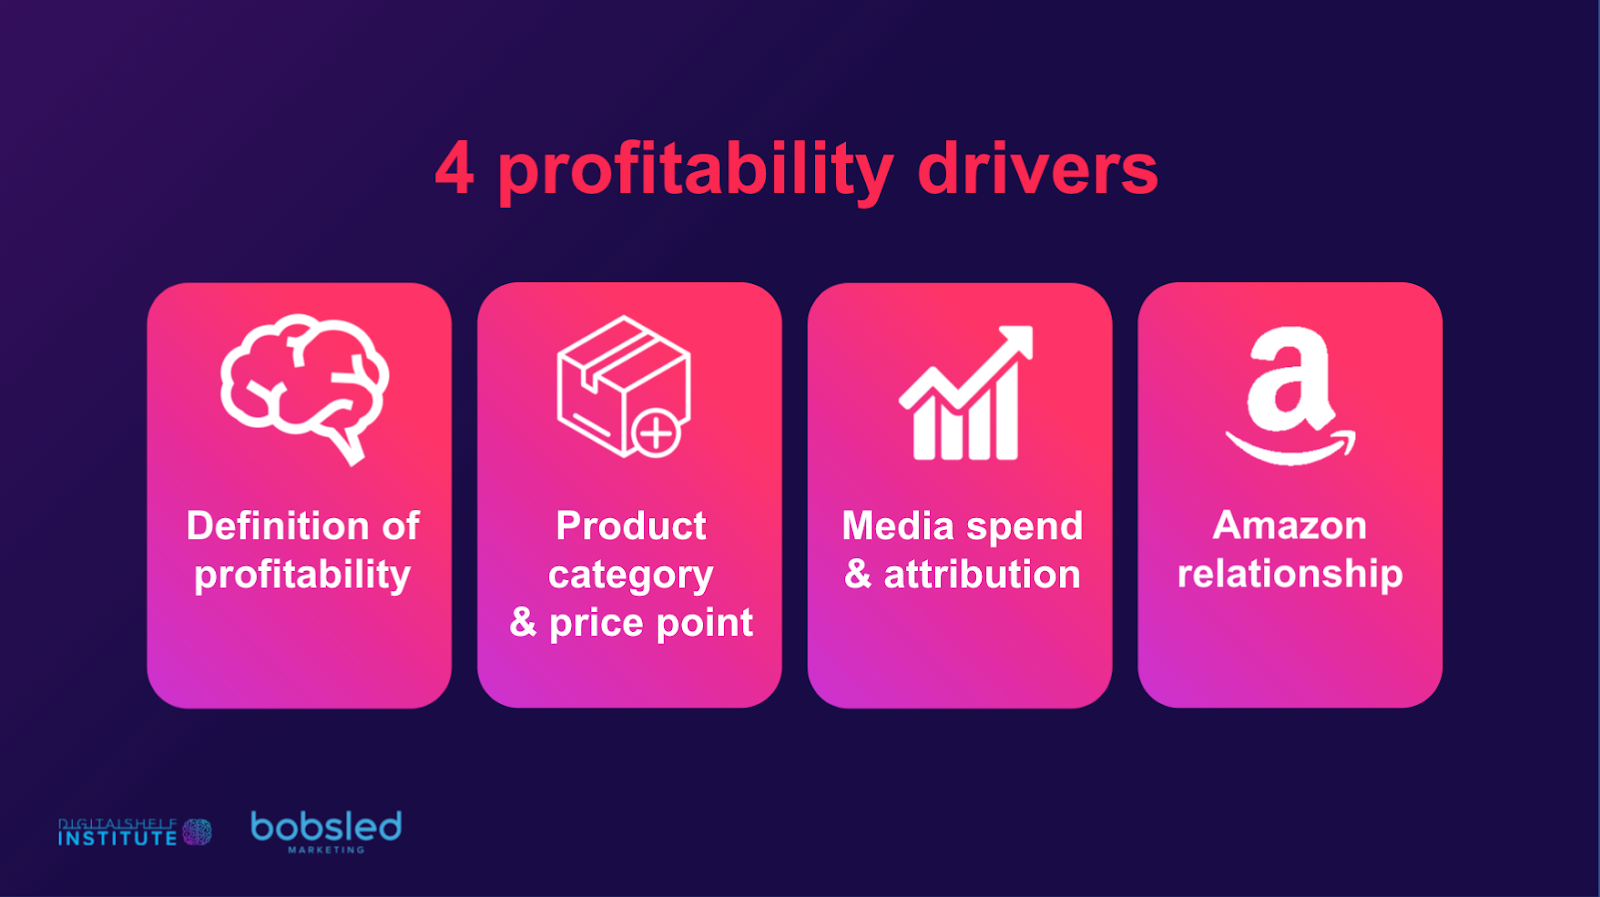
Kiri has outlined the 4 primary drivers of profitability across the digital shelf below, along with pertinent real-world examples from the executive report respondents.
#1 Definition of profitability
Some companies define profitability with contribution margin. Others have less forgiving metrics like net income from operations. And then different departments often have vastly different profitability goals.
Several respondents said that understanding all of the contributing data points in the P&L was the single most important factor in improving profitability. There were examples of significant improvements made when leaders took on the challenge of querying the accounting. In one case, a respondent discovered that certain items like coupons were being apportioned to all channels, including Amazon, which does not accept coupons. Line-by-line inquiries are a tedious but effective way to claw back profitability.
Here’s something else to consider: could you do something unexpected or revolutionary by managing each SKU as its own business? Several respondents recommended this approach.

One respondent said "We're really making a big, big push right now into item-level profitability, item-level tracking. Internally, what we call managing each product as a business." The profitability model of a SKU might initially suggest that it shouldn't be sold online, but after some inquiry, solutions like multipacks might be discovered on a SKU-by-SKU basis.
In general, brands should be looking to centralize commercial teams, KPIs, and decision-making to drive more first-mover behaviors.
 Watch the DSI profitability webinar replay featuring Kiri Masters
and reps from Salsify and firstmovr NOW!
#2 Product category and price point
Each product category comes with unique limitations. Average Selling Price (ASP), the relative size of ecommerce compared to other channels, manufacturing and logistics costs, and product packaging are all relatively unchangeable. While many of these factors are fairly innate, it’s helpful to know exactly how they will impact your profitability.
There are, however, a few things you can directly impact.
One respondent said that revisiting packaging design was one of their top-three biggest drivers of profitability. Changing packaging from store-optimized to ecomm-optimized can open up a ton of margin instantly.
Another is manufacturing costs. As one respondent said "When you own the factories, you have to keep the factories busy. So, that means you gravitate towards your lower-cost products in order to create flow. That's millions in products just keeping that factory humming." The respondent added that an appropriate allocation of warehouse costs across business units is critical.
A couple of other factors to bear in mind:
- Creating “tentpole” products e.g. products that meet a retailer's exclusivity requirements and cannot be algorithmically repriced.
- Creating and implementing a MAP and infringement program will not solve all your problems. MAP policies can treat the symptom, but not the cause, of price degradation.

Download the full DSI & Bobsled profitability report HERE!
#3 Media spend & attribution
The ‘halo’ effect of retail media is a very real thing. Past DSI research discovered that both brands and retailers measured a range of $7 to $11 spent in-store for every dollar spent online via retail media campaigns.
As such, several respondents agreed that they would benefit from rationalizing their brand and performance marketing spend, given the halo effect of advertising across all channels. Instacart is a particularly challenging channel from this perspective, as many companies consider Instacart media spend as "digital," but sales materialize at the retailer customer level (Costco, CVS, Sephora, etc.) on the P&L.
Check out all of Bobsled’s Instacart Resources
So, what is the optimal amount of media ad spend?
One respondent in the report said that their Amazon performance marketing spend as a percentage of revenue hovers around 4%, but establishing specific targets against total revenue can be limiting. This respondent added, "Amazon will say spend should be around two to four percent of your total sales, which is fine for loose benchmarking, but it shouldn't be taken as gospel without testing. What I do is try to find that ceiling on a per-ASIN basis. If my daily spend on a certain ASIN is $500, we're going to crank that to $1,500 and see where the cliff really is. That's the only way we've learned the right amount for each ASIN."
#4 Amazon relationship
With Amazon being the largest source of ecommerce revenue for most brands, reviewing the selling relationship and tightening trade terms with Amazon can be one of the highest leverage activities for a brand looking to improve profitability.
Simply getting better at negotiating vendor terms with Amazon can change things drastically. This is easier said than done, but the profitability payoffs can be massive.
Check out Successfully Negotiate Vendor Terms with Amazon
Other strategies to explore include:
- Redirecting non-legible funds like co-op or CRaP losses towards more legible spend on Amazon performance advertising
- Considering a 3P model whether through a hybrid model or through resellers
Need help improving your ecommerce profitability?
Book a FREE consultation with one of our experts today!
Read more from this author: